


The Dao of the Tariff War
The harmony underneath the apparent chaos of the tariff war

In an earlier post, I wrote about the parallels between the 19th-century Opium Wars between the UK-China and the modern US-China trade wars. In this post, I will explain Trump’s tariff wars from the perspective of Daoist cosmology.
For decades, the United States bought way more from China than it sold to them. This created a trade deficit, kind of like running up a huge tab at your favorite store but never paying it off. From 1985 to 2024, this deficit just kept growing.
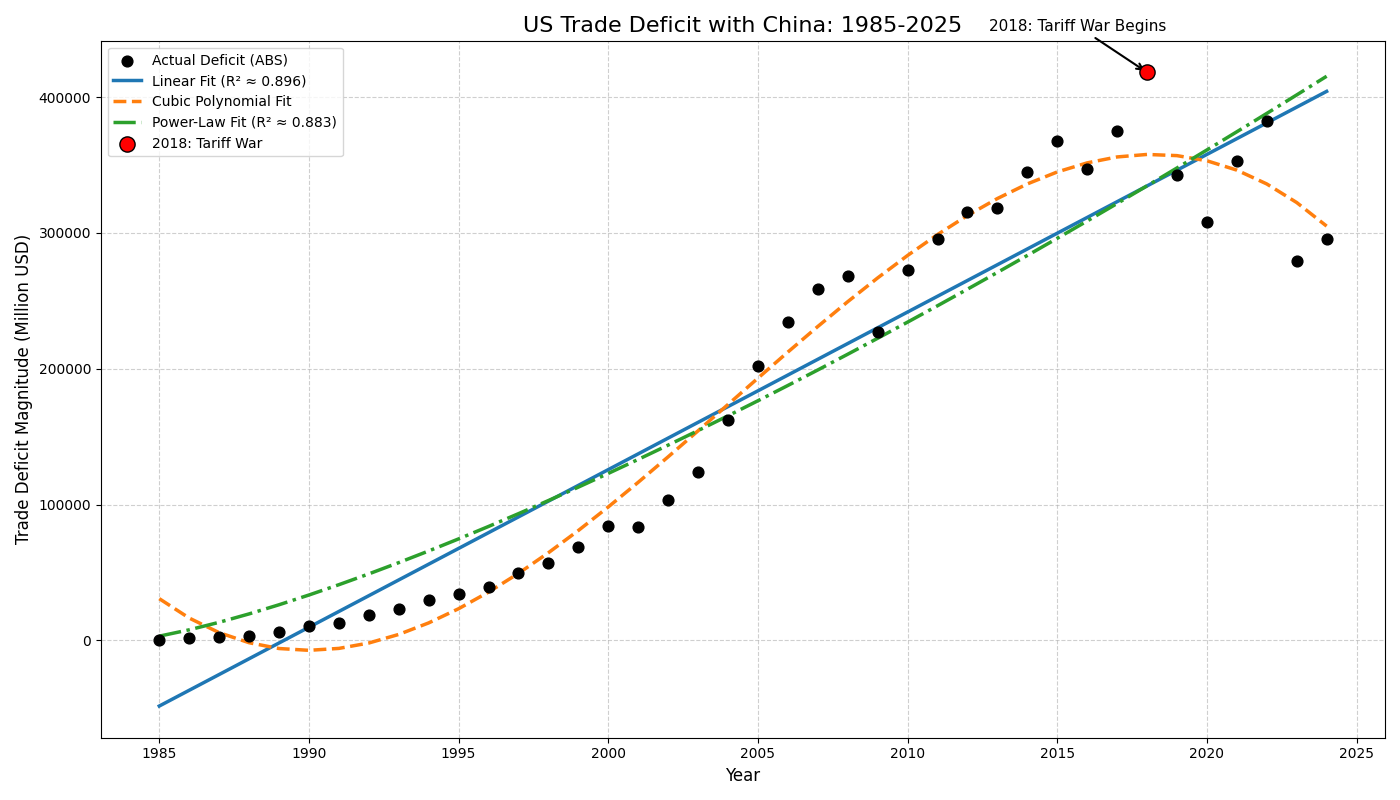
Let’s start with data of the magnitude of U.S. trade deficit with China from 1985-2024. To really see what’s going on, I use three types of curves (called “fits”) to model the shape of the graph. This is finding the best path that matches where the data is going.
This graph tells an incredible story. Not just of money, but of momentum, disruption, and even a little ancient wisdom from the Dao.
The graph contains the actual data of the absolute magnitude of US trade deficit with China from 1985-2025. Then, I fit curve to the actual data, using specific mathematical models: linear, power-law, cubic polynomial fit, using a Python script (to run this yourself, I include the python script at the end of this post).
The script adjusts the parameters of each model (like slope for the linear model or exponent for the power-law) to minimize the difference between the model's predictions and the actual data points. This process is called least squares fitting. The result is a set of parameters (like slope or exponent) that best describe the data according to each model. The script then uses these parameters to create predictions — the model's best guess of the trade deficit for each year.
The linear model finds a line (with a slope and y-intercept) that best fits the data. It doesn’t guess random numbers; it calculates the line that minimizes the error between the line and the actual data points. The power-law model looks for a curve that matches how things grew faster over time (like a snowball rolling down a hill). It calculates the exponent that best fits the data. And the cubic polynomial model uses a curve that can bend in different ways to match more complex changes in the data. It fits the curve by adjusting coefficients to minimize the difference between the data and the model.
The R² value tells us how well that model matches the real data. A high R² means the model's predictions are close to the actual values, and a low R² means the model doesn't fit well.
R², or "R-squared", is a number that tells us how well a model matches the real data.
You can think of it like a grade or a truth meter:
R² = 1 → The model is a perfect match. Every point is exactly on the line.
R² = 0.90 → The model is a very good match. It gets 90% of the pattern right.
R² = 0.50 → The model is so-so. It’s guessing okay, but missing a lot.
R² = 0 or less → The model is worse than guessing randomly.
Here’s the R² scores of each model:
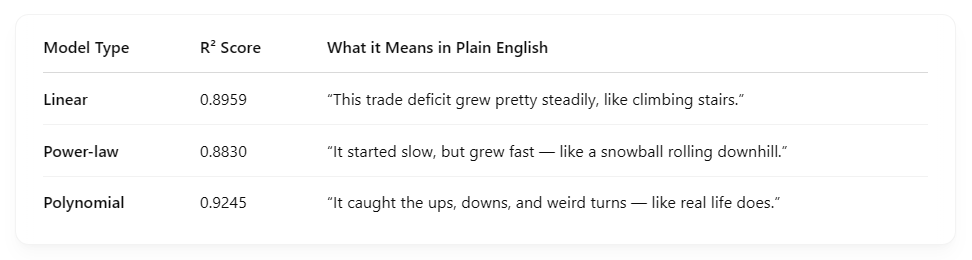
So even though the polynomial curve had the highest R², the linear model was also really good — and easier to understand. The power-law did great in early years, but not as good after 2018.
Linear Fit - The Escalator
Steady. Predictable. Unstoppable.
The linear model is like an escalator going up — the trade deficit grew by about the same amount every year. It didn’t shoot up fast, it just kept climbing. his model tells us: the trade imbalance didn’t explode — it just refused to slow down.
Like a river that never changes speed — just keeps flowing.
Power-Law Fit – The Rocket at First
Slow start. Big acceleration.
The power-law model begins slowly and then grows faster and faster, like a rocket launching. In the early years, the U.S. wasn’t importing that much from China — but then trade took off.
This model tells us: the trade relationship built momentum — and if nothing stopped it, the deficit might’ve grown out of control.
But spoiler alert: something did stop it.
Cubic Polynomial Fit – The Real-Life Curve
Smooth with dips, bumps, and turning points.
The cubic polynomial model is more flexible. It doesn’t assume everything grows the same way. Instead, it shows where things sped up, slowed down, or reversed — like during the 2008 financial crash or the 2020 pandemic.
This model tells us: real life isn’t always smooth. Even powerful trends hit speed bumps.
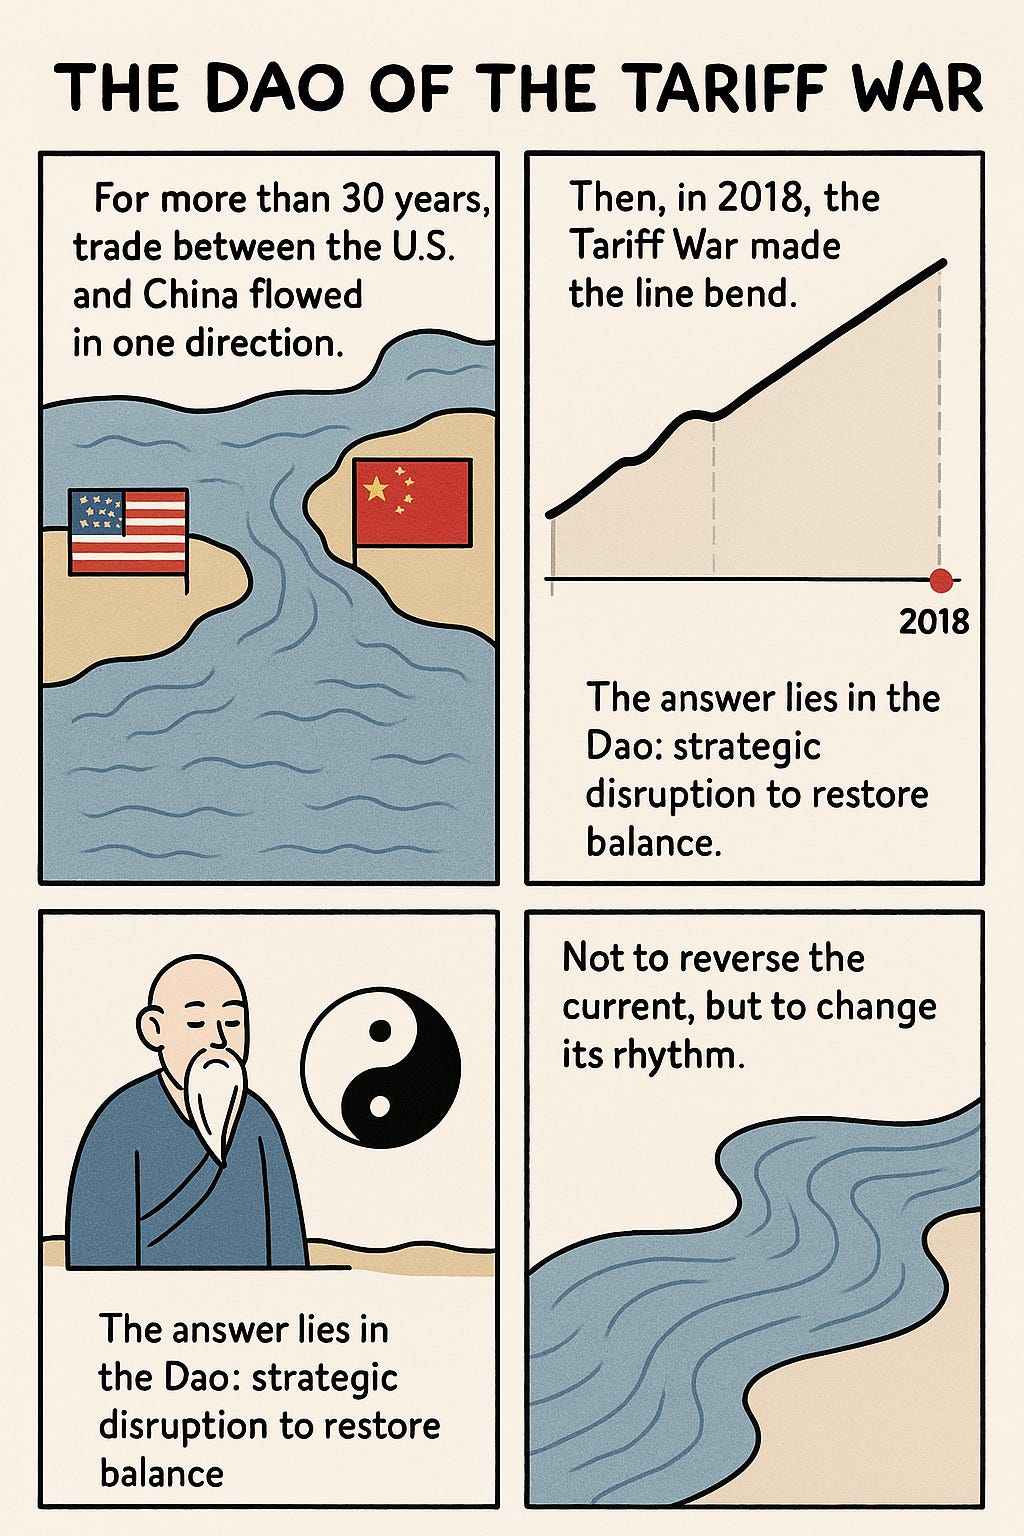
The Dao of the Tariff War
In Daoist philosophy, the Dao means "the Way" — the natural flow of things. Like water running downhill, clouds drifting, or bamboo swaying in the wind.
In 2018, President Donald Trump started a tariff war with China. He raised taxes on Chinese goods entering the U.S., making them more expensive. The idea? If Americans had to pay more for things made in China, they might buy less. That would slow down the one-way flow.
It was bold. Loud. Controversial. But when we look at the graph again, something strange happened: The line bent. For the first time in decades, the trade deficit didn’t keep growing like before. It slowed. It flattened. The endless river didn’t reverse — but it didn’t flow the same way either.
Trump’s tariff war might have seemed aggressive — but from a Daoist point of view, it was a disruption to restore balance. Trump wasn’t trying to destroy the relationship. It was trying to shift it from a one-sided flow to something more equal.
Sometimes, to follow the Way, you have to nudge the river. Not dam it. Not drain it. Just remind it that it doesn’t have to flood only one side. It was about changing its imbalance. It was a way of saying: "This trade flow has gone too far in one direction — let’s adjust it." And that’s exactly what happened. The graph bent, because the flow changed. The Dao isn’t about fighting the flow. It’s about knowing when to shift it.
And the Dao teaches us how balance is sometimes restored — not by force, but by knowing exactly when to shift the flow.
The Tariff War wasn’t chaos. It was a course correction. Like the Dao, it didn't seek revenge. It sought rebalancing. In the face of linearity, it was the curve. That’s the Dao of the Tariff War.
What should China do from a Daoist perspective
Embrace Flexibility, Not Force. As course correction brings disruptions to the usual flow, in the face of external challenges, especially the trade war, one must adopt a policy of flexibility. Just as water flows smoothly around rocks, China should adapt to external pressures without reacting aggressively or rigidly.
Policy Suggestion
Diversify Trade Partnerships: Increase trade agreements with countries in Asia, Africa, and Europe, ensuring that China’s economy isn’t overly dependent on any single nation. This will help mitigate risks from shifting policies in the U.S. or other parts of the world.
Expand Regional Influence: Leverage initiatives like the Belt and Road Initiative (BRI) to deepen ties with neighbouring countries, fostering economic interdependence and regional stability. This promotes the idea of mutual benefit, not zero-sum competition.
Strengthen the Domestic Foundation. Rather than focusing solely on external trade, look inward to build resilience and self-sufficiency. Like a tree that grows strong roots, China must deepen its domestic economy to weather external changes, allowing for more sustainable growth.
Policy Suggestion
Invest in Domestic Consumption: Create policies that encourage Chinese consumers to spend more domestically. Support the growth of local businesses, promote innovation, and strengthen consumer confidence. This reduces the need for exports and increases the economic strength from within.
Develop Critical Technologies: Focus on innovation, particularly in high-tech industries like AI, semiconductors, and renewable energy. By reducing reliance on foreign technologies, China can ensure long-term economic independence.
Adapt to the Flow of the Inevitable Course Correction of the Tariff War. Change is constant. The Dao teaches that we should embrace change instead of resisting it. As the global economy evolves, so should China’s strategies. Use the Tariff War as a reminder that adaptation is key — be it economic, technological, or diplomatic.
Policy Suggestion
Leverage Technological Leadership: Lead in emerging technologies like 5G, AI, and blockchain. Focus on exporting Chinese innovation rather than just manufactured goods. As the world moves into new technological eras, position China at the forefront.
Adopt Green Energy: Invest in renewable energy sources and environmental technologies. This aligns with the global shift toward sustainability and would place China as a leader in the future green economy.
Balance Internal and External Relations. While external pressures may seem like challenges, they also provide opportunities for growth and transformation. China should continue engaging with the U.S. and other countries, but on terms that are fair and balanced. Be willing to negotiate and cooperate for mutual benefit.
Policy Suggestion
Seek Fair Trade Agreements: Engage with the U.S. and other global powers to build trade agreements that promote fairness and balance. While standing firm on China’s rights, strive for cooperative solutions that acknowledge the interconnectedness of the world economy.
Promote Global Stability: Use China’s growing diplomatic and economic power to foster peace and stability in regions of conflict. China’s ability to maintain neutrality and cooperation will be key in shaping a future of global harmony.
Cultivate Inner Peace for External Success. True power comes from inner harmony. If China’s internal economy, policies, and society are balanced and resilient, its external success will naturally follow. This is the ultimate lesson of the Dao — self-mastery leads to global influence.
Policy Suggestion
Social Stability and Happiness: Promote policies that improve the well-being of China’s citizens, focusing on health, education, and quality of life. A happy, healthy, and educated population is the foundation of a strong economy and society.
Encourage Cultural Diplomacy: Just as the Dao promotes balance between opposites, China should celebrate its culture globally, fostering cultural exchange. This would create stronger global connections and mutual respect between nation
import numpy as np
import matplotlib.pyplot as plt
from scipy.optimize import curve_fit
from sklearn.metrics import r2_score

# -----------------------------
# US-China trade deficit data
# -----------------------------
years = np.arange(1985, 2025)
t = years - 1985  # normalized time
y = np.abs(np.array([
    -6.0, -1664.7, -2796.3, -3489.3, -6234.3, -10431.0, -12691.0, -18309.0, -22777.0, -29505.1,
    -33789.5, -39520.2, -49695.5, -56927.4, -68677.1, -83833.0, -83096.1, -103064.9, -124068.2,
    -162254.3, -202278.1, -234101.3, -258506.0, -268039.8, -226877.2, -273041.6, -295249.7,
    -315102.5, -318683.8, -344817.7, -367328.3, -346825.2, -375167.9, -418232.9, -342629.5,
    -307966.5, -352806.9, -382133.8, -279107.2, -295401.6
]))

# -----------------------------
# Linear model
# -----------------------------
def linear_model(x, a, b):
    return a * x + b

linear_params, _ = curve_fit(linear_model, t, y)
linear_pred = linear_model(t, *linear_params)
linear_r2 = r2_score(y, linear_pred)

# -----------------------------
# Polynomial model (degree 3)
# -----------------------------
poly_coeffs = np.polyfit(t, y, 3)
poly_model = np.poly1d(poly_coeffs)
poly_pred = poly_model(t)
poly_r2 = r2_score(y, poly_pred)

# -----------------------------
# Power-law model
# -----------------------------
def power_law_model(x, a, b):
    return a * np.power(x + 1, b)  # avoid zero

power_params, _ = curve_fit(power_law_model, t, y, maxfev=10000)
power_pred = power_law_model(t, *power_params)
power_r2 = r2_score(y, power_pred)

# -----------------------------
# Print R² values and interpretation
# -----------------------------
print("\n--- Model R² Scores and Interpretations ---\n")

print(f"Linear Fit R² = {linear_r2:.4f}")
print("➡️  This means the trade deficit grew at a steady rate. The model explains ~90% of the pattern.")

print(f"\nPower-Law Fit R² = {power_r2:.4f}")
print("➡️  The early part of the trade relationship grew like a rocket. This model captures early acceleration, but struggles later.")

print(f"\nCubic Polynomial Fit R² = {poly_r2:.4f}")
print("➡️  This model captures bumps and slowdowns (like 2008 crash or COVID). It's more flexible for real-world events.")

# -----------------------------
# Visualization
# -----------------------------
highlight_year = 2018
highlight_index = highlight_year - 1985

plt.figure(figsize=(14, 8))

# Actual data
plt.scatter(years, y, color='black', label='Actual Deficit (ABS)', s=60, zorder=3)

# Model predictions
plt.plot(years, linear_pred, label=f'Linear Fit (R²={linear_r2:.3f})', linewidth=2.5)
plt.plot(years, poly_pred, label=f'Cubic Polynomial Fit (R²={poly_r2:.3f})', linestyle='--', linewidth=2.5)
plt.plot(years, power_pred, label=f'Power-Law Fit (R²={power_r2:.3f})', linestyle='-.', linewidth=2.5)

# Highlight 2018
plt.scatter(years[highlight_index], y[highlight_index], color='red', s=120, edgecolor='black', zorder=5, label='2018: Tariff War')
plt.annotate("2018: Tariff War Begins",
             (years[highlight_index], y[highlight_index]),
             textcoords="offset points",
             xytext=(-50, 30),
             ha='center',
             fontsize=11,
             arrowprops=dict(arrowstyle="->", lw=1.5))

# Format plot
plt.title("US Trade Deficit with China: 1985–2024 (Model Comparison)", fontsize=16)
plt.xlabel("Year", fontsize=12)
plt.ylabel("Trade Deficit Magnitude (Million USD)", fontsize=12)
plt.legend()
plt.grid(True, linestyle='--', alpha=0.6)
plt.tight_layout()
plt.show()
Liked what you read? Please FORWARD this to your friends via email and/or share to your Facebook. Also, consider sending a tip to keep this sustainable and independent via Buy Me A Coffee or via GCash (click for QR Code).
If we have scholars like you Miss Sass working in our government, our country can possibly compete in any global spectrum.
Astig ng china hindi na basta bast kaya nang malampasan ang U.S